


Measure the deviation between
two objects
Use the tools in the Locators > Deviation sub-palette to show comb plots measuring the deviation between objects.
Measure the exact deviation between two curves at a single location
A measurement appears indicating the distance between the selected point on the first curve and the closest point on the second curve.
Add a deviation comb plot between two objects
 .
.
 .
.
 .
.
 .
.
 .
.
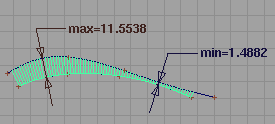
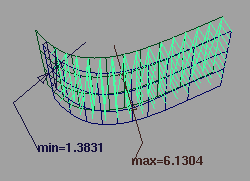
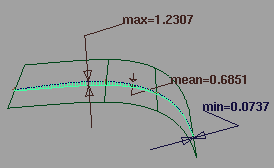
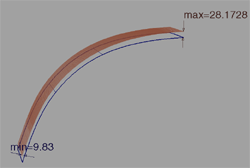
The tool displays a deviation comb indicating the deviation across the length of the objects, labeling the minimum, maximum, and mean. The Mesh to Surface deviation tool only displays the minimum and maximum deviations.
 to change the scale of the
quills.
to change the scale of the
quills.
 to change the density of
the quills.
to change the density of
the quills.
View the exact numeric values from a deviation locator
Choose Windows > Information > Deviation Table  .
.
 .
.